

A custom token might not appear automatically in your wallet interface right away. This usually happens when an asset is very new or has not yet been indexed in the default list. In these cases, users can easily add it manually using the app’s internal features.
This simple guide walks you through adding a custom asset to Klever Wallet in just 6 easy steps, helping ensure your funds are visible, accessible, and securely managed.
What Is a Custom Token?
It is any digital asset that is not yet indexed by Klever Wallet but exists on a supported blockchain network. These cryptocurrencies are fully functional, but they may require manual addition so the app can recognize and display them correctly.
Since this is a non-custodial wallet, users interact directly with networks without relying on a centralized intermediary. This means you can include new coins by providing the correct contract address, allowing the system to identify the asset and display it in your portfolio.
Manually inserting an asset does not create a new one and does not modify the blockchain in any way. It simply enables the interface to recognize existing balances and allows you to send transactions and manage your funds safely.
Before You Start
Before proceeding, make sure you have the following information ready:
- The exact contract address
- The correct blockchain network
Having accurate details is essential to ensure the asset is imported correctly and displayed properly. Entering the wrong network or address may prevent the balance from appearing or result in displaying incorrect data.
You can usually find this information on official block explorers such as:
- Etherscan
- BscScan
- Solscan
Other explorers depend on the specific chain you are using. Always verify the address from official project sources to avoid importing fake or scam assets.
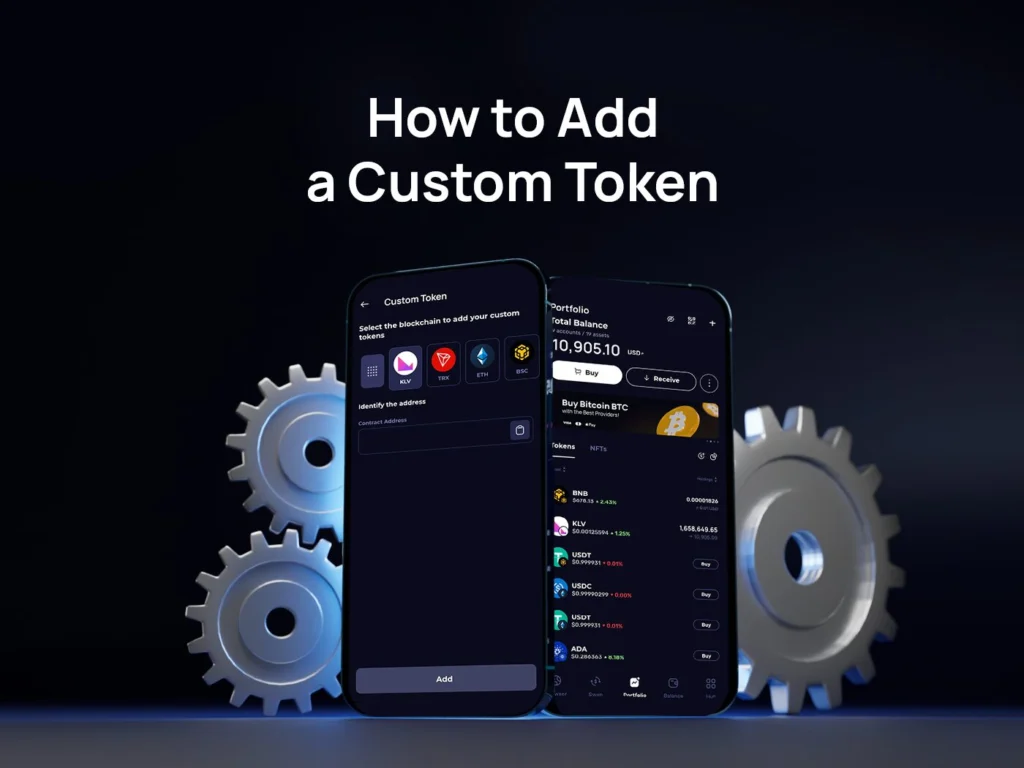
How to Add a Custom Token
Follow these 6 straightforward steps to update your portfolio:
1. Open Klever Wallet
Launch the app on your mobile device.
2. Access the Asset List
On the main screen, tap the “Add Token” option.
3. Select “Add Custom Token”
Choose this option from the menu.
4. Choose the Network
Select the blockchain where the asset exists. For example:
- Ethereum
- BNB Chain
- Polygon
- Solana
Selecting the correct network is essential for the balance to display properly.
5. Enter the Contract Address
Paste the official alphanumeric code of the cryptocurrency.
6. Confirm and Save
After verifying the information, tap to confirm. The asset will now appear in your balance list.
Important Security Tips
When managing new cryptocurrencies, always follow these security best practices:
- Verify the official contract address from the project’s website or verified social channels.
- Avoid copying addresses from unknown sources.
- Be cautious of airdrops sent by unknown wallets — they may be spam.
Remember: Klever never has access to your funds, and you remain in full control of your assets.
Frequently Asked Questions (FAQ)
What should I do if the balance still doesn’t show up?
If you have followed all the steps and the funds are not visible, double-check the blockchain network and the contract address. Even a minor typo can prevent the system from locating your funds. Additionally, ensure your internet connection is stable and try refreshing the app dashboard.
Is it safe to import any contract address?
While the process of importing an address is technically safe, interacting with malicious assets is not. Scammers often create fake versions of popular cryptocurrencies. Always verify the source. Simply viewing a scam coin in your portfolio usually won’t compromise your wallet, but attempting to swap, approve, or sell it might trigger malicious smart contracts.
Can I remove an asset later?
Yes. If you no longer want to track a specific cryptocurrency, you can easily toggle it off or remove it from your main portfolio view in the settings. This helps keep your dashboard clean, organized, and focused only on the projects you care about.
Why Use Klever Wallet?
Our app is designed to give users full control of their digital wealth while maintaining a seamless and secure experience. With it, you can:
- Store and manage thousands of cryptocurrencies
- Access multiple blockchain networks
- Swap assets directly within the interface
- Maintain full self-custody of your funds
Embrace True Financial Freedom
The decentralized web offers unprecedented opportunities to grow and manage your wealth independently. By understanding how to navigate these tools—like manually adding new projects to your portfolio—you are taking an active role in your financial future. Klever is built to be your reliable partner in this journey, combining military-grade security with an intuitive user interface.
If you haven’t installed the app yet, download it today and take full control of your digital assets. Explore the power of self-custody, seamless multi-chain support, and advanced crypto management in one single, easy-to-use platform. Join millions of users worldwide who trust our ecosystem to safeguard their financial independence.